
Statement of Educational Effectiveness
In accordance with the norms of the Program of Priestly Formation, Mount Angel Seminary has four institutional goals, which are identified and explained in the Academic Catalog:
- Human Formation
- Spiritual Formation
- Intellectual Formation
- Pastoral Formation
Each of these four goals is assessed individually using the process described in the Seminary’s Assessment Handbook.
The Seminary also assesses its institutional effectiveness on the basis of its service to the Church, the placement and active ministry of its graduates, and the academic achievement and vocational discernment of its seminarians.
Service to the Church
Since its establishment in 1889, Mount Angel Seminary has served the Church primarily by forming men for the Catholic priesthood.
For the 2025–2026 academic year, the Seminary is entrusted with the formation of seminarians from 21 Catholic archdioceses and dioceses, as well as 4 Catholic religious communities:
-
- Archdiocese of Anchorage-Juneau
- Archdiocese of Galveston-Houston
- Archdiocese of Las Vegas
- Archdiocese of Portland in Oregon
- Archdiocese of Santa Fe
- Archdiocese of Seattle
- Diocese of Baker
- Diocese of Boise
- Diocese of Fresno
- Diocese of Great Falls-Billings
- Diocese of Orange
- Diocese of Pueblo
- Diocese of Reno
- Diocese of Sacramento
- Diocese of Salt Lake City
- Diocese of Samoa Pago-Pago
- Diocese of San Jose
- Diocese of Spokane
- Diocese of Stockton
- Diocese of Tucson
- Diocese of Yakima
- Mount Angel Abbey
- Saint Joseph Abbey
- Saint Martin’s Abbey
- Order of Discalced Carmelites
The trust placed in Mount Angel Seminary by these dioceses and religious communities is one of the most important measures of the Seminary’s fulfillment of its mission.
Placement in Ministry
Mount Angel Seminary’s successful fulfillment of its mission may also be measured by the placement of its graduates in positions of ministry within the Church.
The following table shows the MDiv placement rate over the past 5 years. This rate is defined as the percentage of MDiv graduates from the Graduate School of Theology who were ordained as Catholic priests within 1.5 years of graduation:
| MDiv Graduation Year | Placement Rate |
| 2020 | 100% |
| 2021 | 100% |
| 2022 | 100% |
| 2023 | 100% |
| 2024 | 86% |
| Average | 97% |
Mount Angel Seminary also monitors the percentage of recent graduates from the Graduate School of Theology who remain in active ministry after undergoing priestly formation. The following table shows the active ministry rate as of spring 2026:
| Time Since Graduation | Active Ministry |
| 1 Year | 100% |
| 1–5 Years | 95% |
The following table shows the placement rate for graduates of the College of Liberal Arts over the past 5 years. This rate is defined as the percentage of BA, Certificate in Philosophy, and MA (Philosophy) graduates who enrolled in further priestly formation within 1 year of graduation:
| Graduation Year | Placement Rate |
| 2020 | 71% |
| 2021 | 87% |
| 2022 | 93% |
| 2023 | 93% |
| 2024 | 83% |
| Average | 85% |
Academic Achievement and Vocational Discernment
Mount Angel Seminary supports its seminarians not only in their pursuit of academic achievement but also in their vocational discernment—even if that discernment leads them to withdraw from the Seminary. The goal of the Seminary is not to produce as many priests as possible; it is to form those who have an authentic priestly vocation and to help others to discern their true vocation.
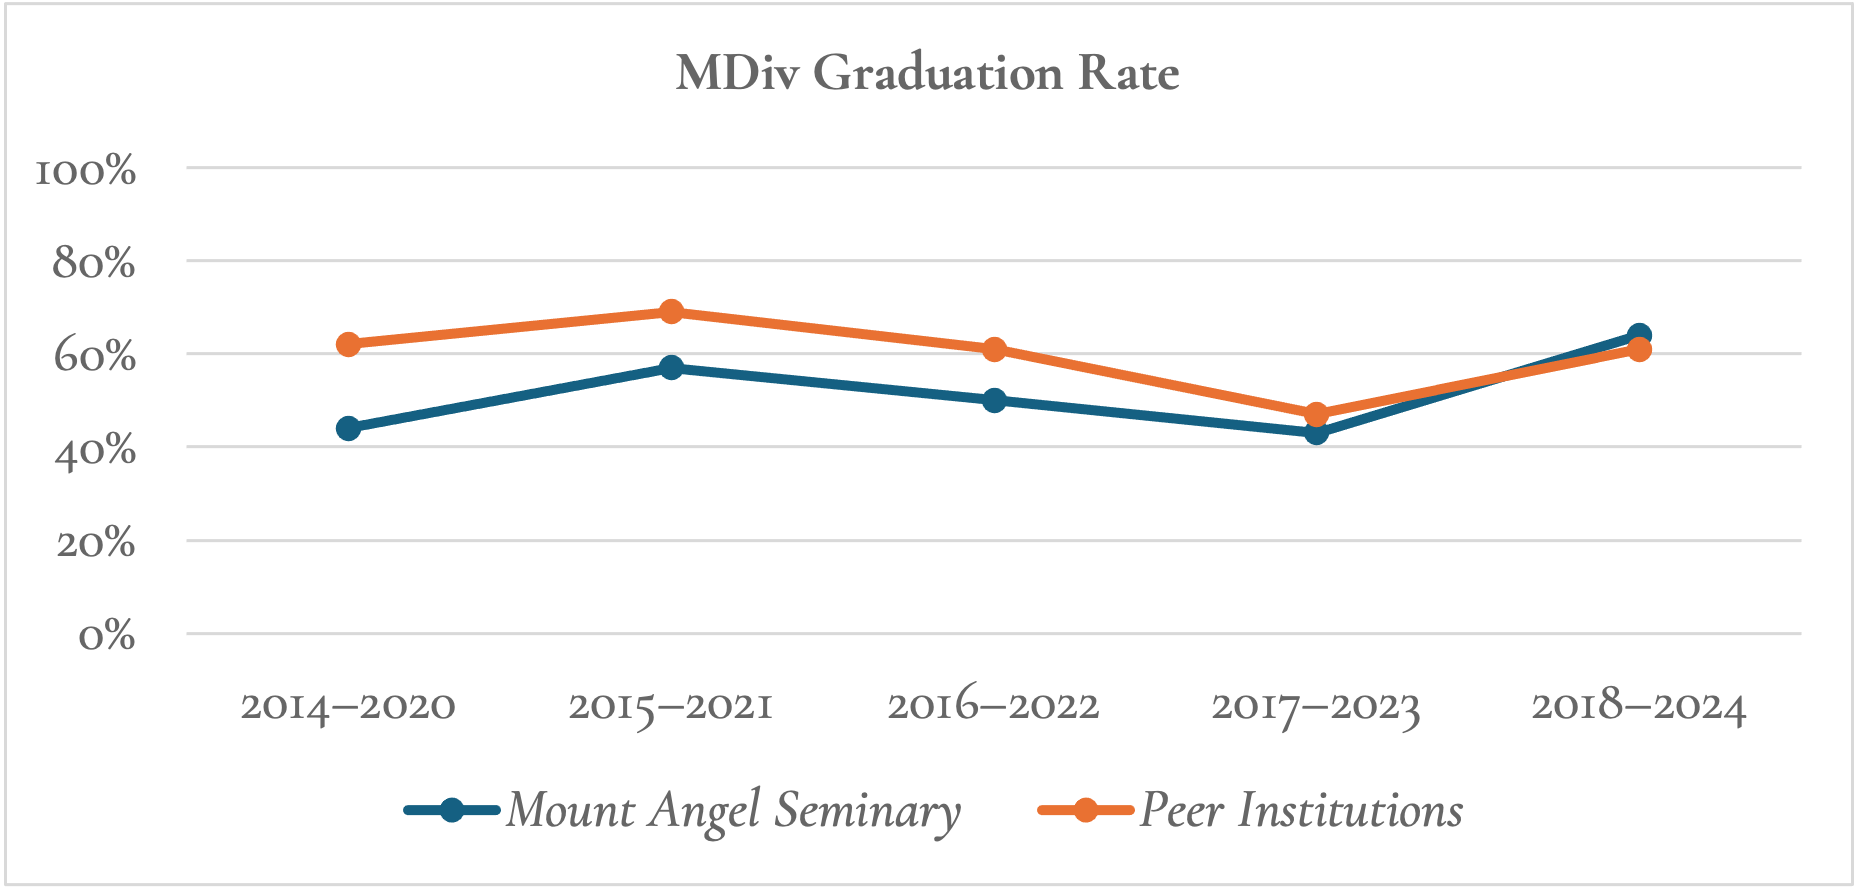
The total number of MDiv degrees completed between 2020 and 2024 is 42. The following table and chart show the graduation rate of the MDiv program in comparison with the average of certain other Catholic seminaries in the United States:
| MDiv Cohort | MAS Graduation Rate | Peers’ Graduation Rate* |
| 2014–2020 | 44% | 62% |
| 2015–2021 | 57% | 69% |
| 2016–2022 | 50% | 61% |
| 2017–2023 | 43% | 47% |
| 2018–2024 | 64% | 61%† |
| Average | 52% | 60% |
* MDiv graduation rates are based on data provided by the Association of Theological Schools (ATS), which defines “graduation rate” as completion of the MDiv degree within 6 years.
† Beginning in 2024, the group of peer institutions represented in this table changed because one of the institutions withdrew its accreditation from the ATS Commission on Accrediting.
The following table provides disaggregated data related to the last 5 MDiv cohorts (2014–2020, 2015–2021, 2016–2022, 2017–2023, and 2018–2024):
| Category (MDiv) | Total of Last 5 Cohorts | Average Graduation Rate |
| All Students | 81 | 52% |
| Students of Color* | 38 | 61% |
| White Students | 43 | 42% |
| Visa Students | 12 | 42% |
| Non-Visa Students | 69 | 52% |
* “Students of color” are students who identify as Asian, Black, Hispanic, Indigenous, Middle Eastern, North African, Pacific Islander, or Multiracial.
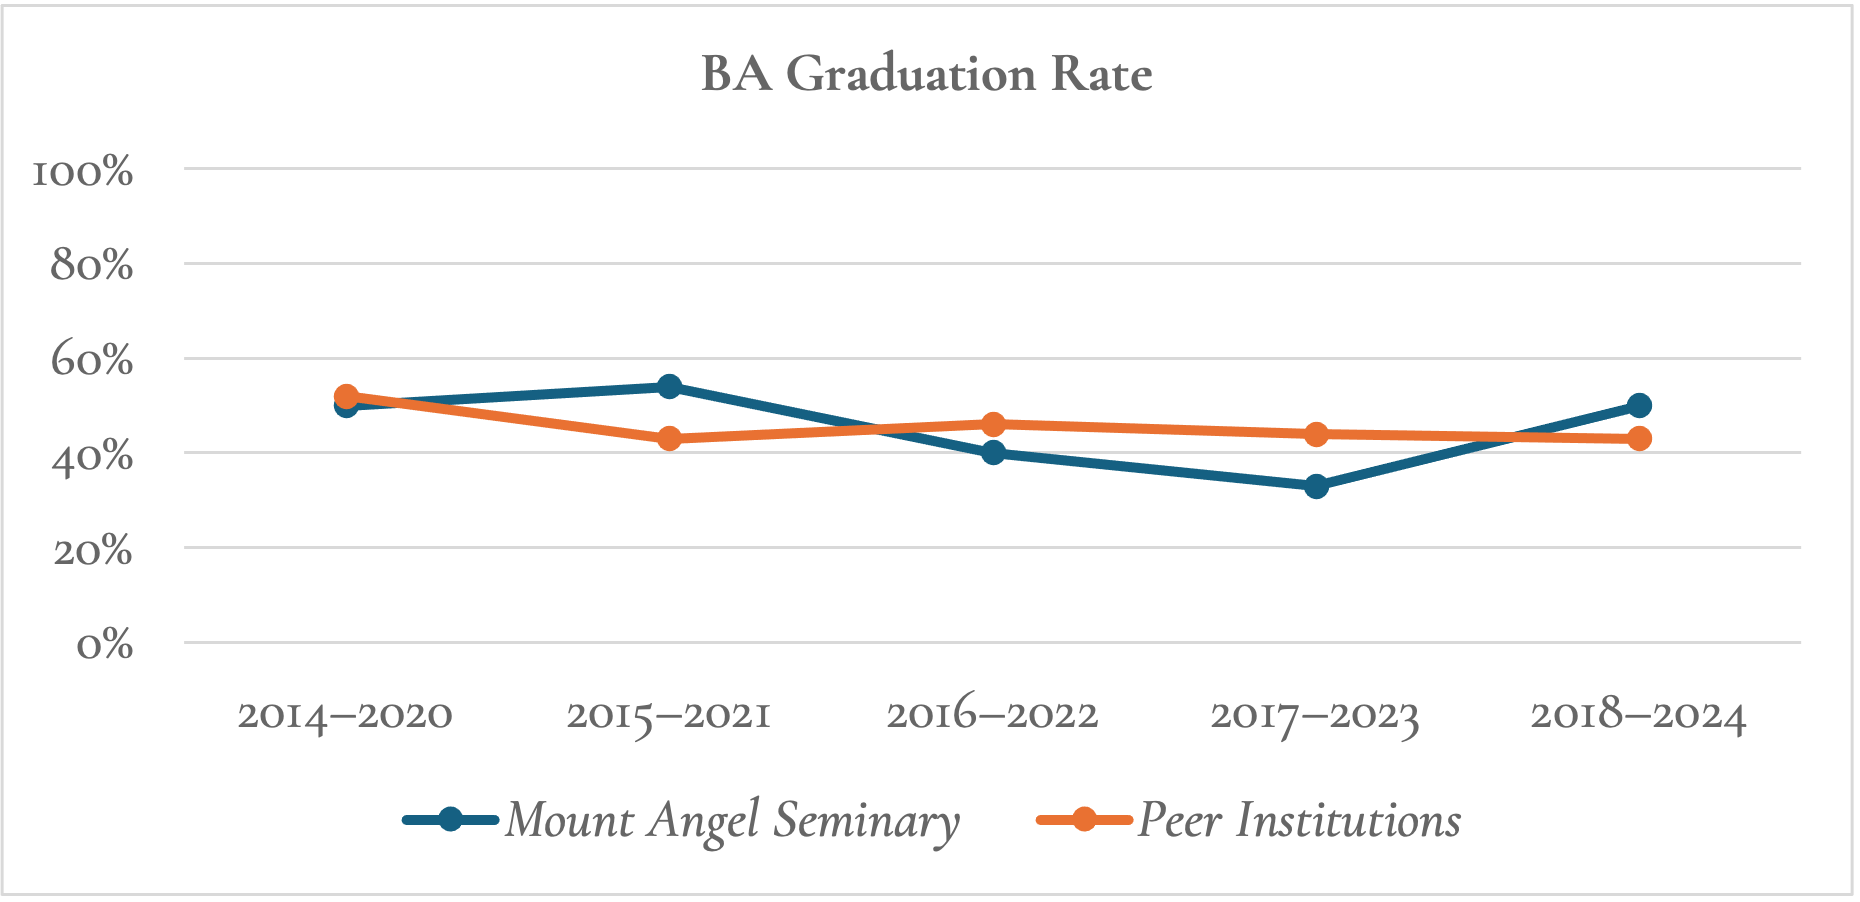
The total number of BA degrees completed between 2020 and 2024 is 39. The following table and chart show the graduation rate of the BA program in comparison with the average of certain other Catholic seminaries in the United States:
| BA Cohort | MAS Graduation Rate | Peers’ Graduation Rate* |
| 2014–2020 | 50% | 52% |
| 2015–2021 | 54% | 43% |
| 2016–2022 | 40% | 46% |
| 2017–2023 | 33% | 44% |
| 2018–2024 | 50% | 43% |
| Average | 45% | 46% |
* BA graduation rates are based on data provided through the Integrated Postsecondary Education Data System (IPEDS), which defines “graduation rate” as completion of the BA degree within 6 years. IPEDS only includes data for full-time, first-time undergraduate students.
The following table provides disaggregated data related to the last 5 BA cohorts (2014–2020, 2015–2021, 2016–2022, 2017–2023, and 2018–2024):
| Category (BA) | Total of Last 5 Cohorts | Average Graduation Rate |
| All Students* | 84 | 60% |
| Students of Color† | 59 | 59% |
| White Students | 25 | 60% |
| Visa Students | 5 | 60% |
| Non-Visa Students | 79 | 59% |
* This table uses the data for all BA students, not only the full-time, first-time undergraduate students recorded in IPEDS.
† “Students of color” are students who identify as Asian, Black, Hispanic, Indigenous, Middle Eastern, North African, Pacific Islander, or Multiracial.
The following table offers an overview of the data for the last 5 cohorts of each of the academic degrees offered by Mount Angel Seminary:
| Degree | Total of Last 5 Cohorts | Average Graduation Rate* |
| BA | 84 | 60% |
| MA (Philosophy) | 22 | 55% |
| MDiv | 81 | 52% |
| MA (Theology)† | 5 | 60% |
| DMin‡ | 18 | 83% |
* In accordance with the practice of IPEDS and ATS, the BA, MDiv, and DMin graduation rates show the percentage of students who completed the degree within 6 years. This table uses the data for the 2014–2020, 2015–2021, 2016–2022,2017–2023, and 2018–2024 cohorts. Similarly, in accordance with the practice of ATS, the MA graduation rates show the percentage of students who completed the degree within 4 years. For the MA (Philosophy) and MA (Theology) degrees, this table uses the data for the 2016–2020, 2017–2021, 2018–2022, 2019–2023, and 2020–2024 cohorts.
† In accordance with the practice of ATS, the MA (Theology) data excludes students who were enrolled in the MDiv as their primary degree program.
‡ Because the DMin program began in 2016, this table only uses the data for two cohorts (2016–2022, 2017–2023, and 2018–2024).
— Updated Feb. 2026